Tile based map servers
Introduction
Slippy maps are everywhere, Google Maps, QGIS, anywhere in the web you can zoom in and out of a cartographic 2D plane, you probably are using a slippy map.
A 2D view makes it easier for the brain to digest higher dimensional data. That’s why slippy maps are used extensively in visualizing various types of data like in weather forecasts, scientific data which can be mapped. Just like how chess boards can represent a battlefield, maps abstract all the inner dynamics of the data points and give a simple way to picture the data.
A technical summary of the modern webmap frontend
Go to https://www.openstreetmap.org/ and open the Networks tab in developers’ console. Your screen should look something like this.

Now zoom in and out of the map, you can see some requests to https://tile.openstreetmap.org/, here’s an example wget of a request of this type.
bash curl 'https://tile.openstreetmap.org/14/12360/7003.png' -o singletile.png
If you inspect this file with your favourite image viewer, it’s a png image of 256x256 pixels in size.
In the Networks tab, you can see hundreds of these requests as you zoom in and out of your location. That’s the essence of web maps. (Well there are some other way to create webmaps - link to a blog I wrote about WMS. )
- The widget one sees in OpenStreetMap is a HTML canvas / div, which renders these tile images.
- Now it doesn’t show random tiles, no?
- The way it selects which tiles to show, depends upon your interaction.
- There is a nice demonstration of this listed in https://www.maptiler.com/google-maps-coordinates-tile-bounds-projection/
- When you go to ‘a place’, it renders the tiles in and around the place to put it simply.
- When you zoom in and out, JS libraries measure ‘how much’ your zoom has changed, and calculate a new location to show tiles in and around that location.
Features of a tile
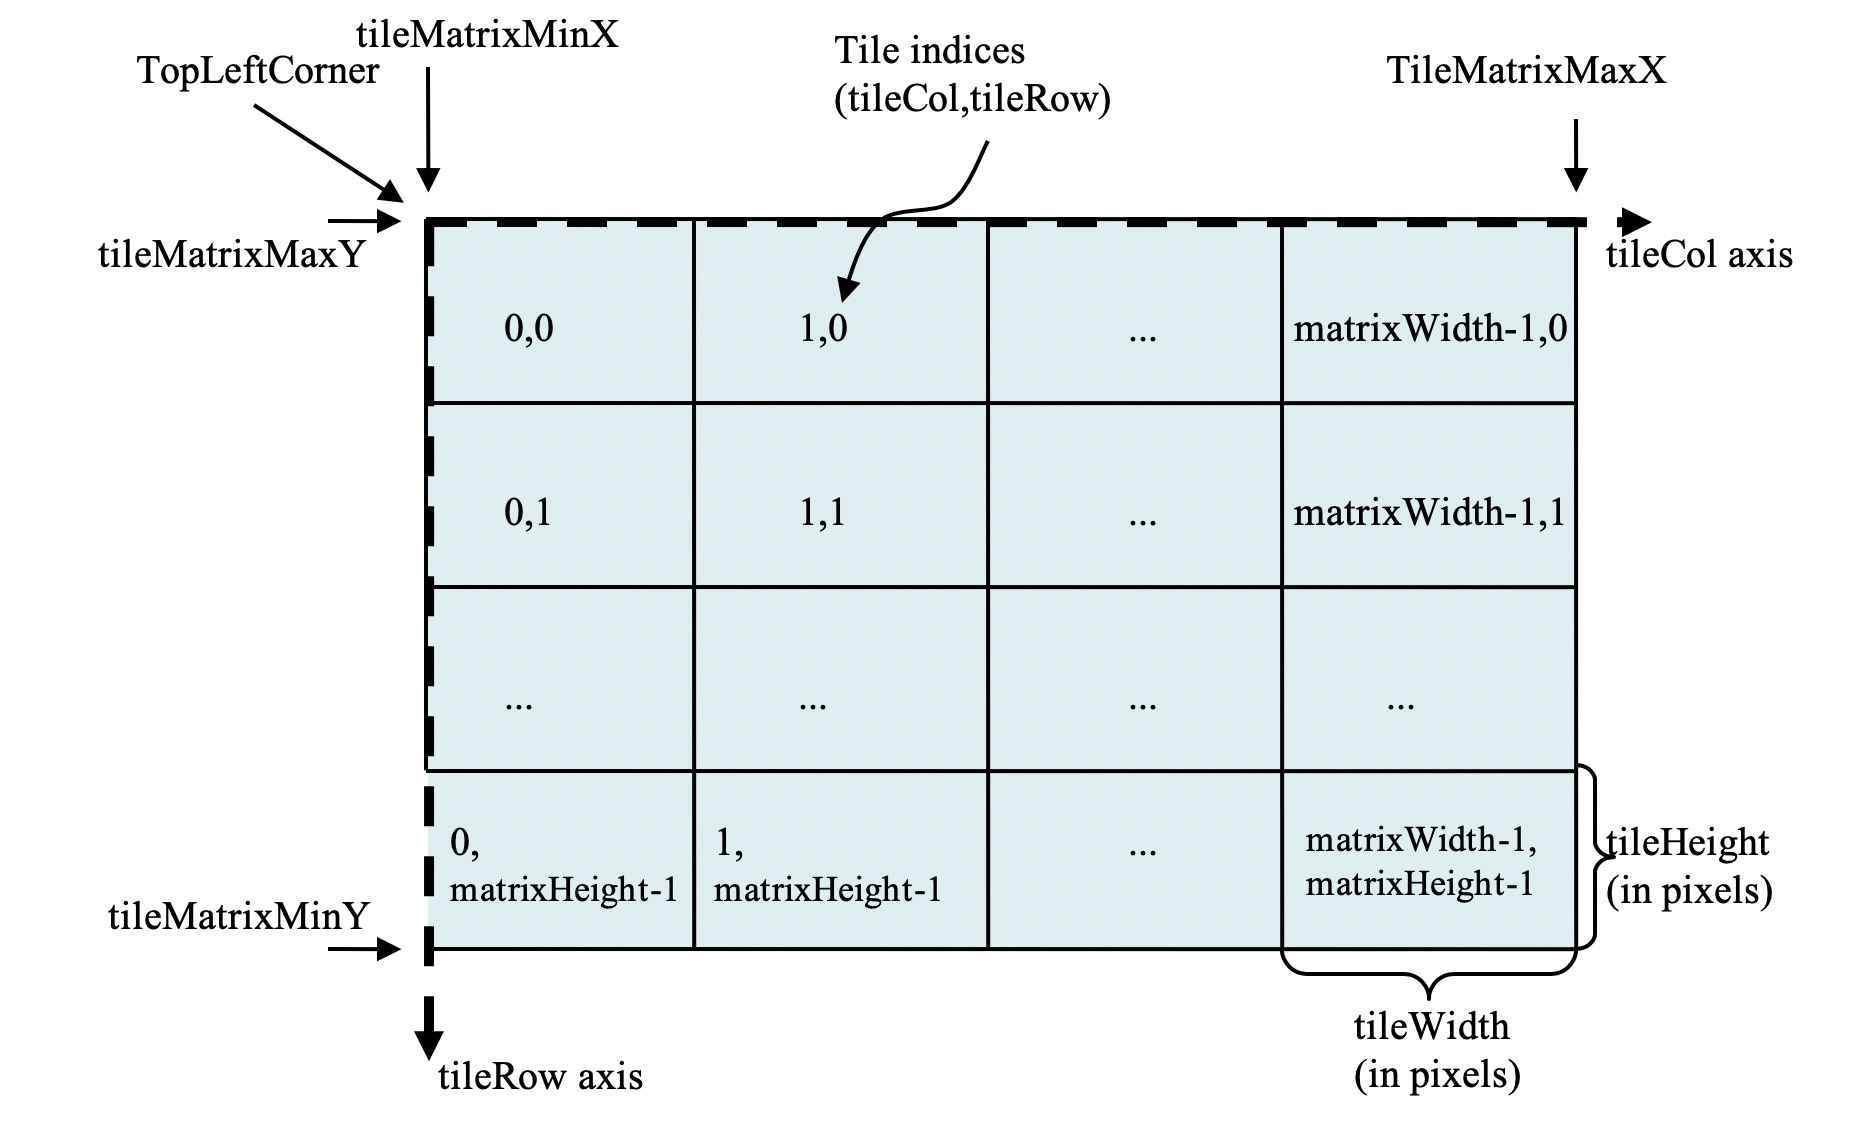
If we look at the uri https://tile.openstreetmap.org/14/12360/7003.png the only parameters to tile server are three numbers 14, 12360, 7003. These three numbers are z, x, and y. They uniquely identify a particular tile a 2D map.
For Global Mercator projection - here’s what happens.
- The globe is projected onto a 2D plane - also represented programatically as TileMatrixSet


- If you’re looking at a particular part of the sphere, the dome is projected onto the plane
- This plane is then split into tiles

- Each tile corresponding to the zoom level - z has indices (x, y) as indices of a 2D array.
- When you zoom into a map, the mouse cursor input isn’t a linear curve, it hops from zoom level to zoom level. So that it’s always an integer.

Tile Servers
Since all tiles are tied to their (z, x, y) values. If we list exhaustively all the possible combinations of these values, and start a static file server, the directory will answer to parts of the map for tiles which exist here.

We can use gdal2tiles.py which comes in-built with gdal to generate this directory from a raster..
There are some cases for which it’s expensive to generate tiles rather then ‘computing’ them on the fly. For cases like this, dynamic tile servers are used.
Sources: